|
|
|
|
Adder Dispersal Distances: |
| Author | Message |
|
calumma Senior Member Joined: 27 Jun 2003 No. of posts: 351 View other posts by calumma |
Posted: 06 Aug 2009 My current take on available literature suggests that adder can disperse over distances of ~ 2km (principally between hibernacula and summer foraging sites). In reality, the majority of such movements are likely to be much less than this - particularly give the fragmented nature of today's countryside. What experiences or opinions do other folks have? You can stop reading this rather long post now! For nerds interested in database stuff I have attempted to explain how I will be using this info below 
I'm attempting to pin down potential movement distances for all species as part of my attempts to better define favourable conservation status in Kent. This follows on from a meeting with NE and HCT that Steve (Vicar) and John Baker also attended. Still a way to go, but results to date are encouraging. KRAG have now been promised full access to the Kent habitat data - provided we can justify that access. Before making the request, I'm trying to put some of the background processes in place to demonstrate how the data will be analysed. One of those processes has been to calculate nearest neigbour distances for all records in the database. The database has been able to calculate distance between records for some time, but this information is calculated on the fly and not saved. I have now added a script that calculates nearest neighbour for each record and saves the result in a separate field. Unfortunately having more than 22,000 records on the system means that there are several thousand records for each species and this process takes a little while. Each of the species records has to calculate distances to every other of the records of that species to find out which one is the nearest 
One application of nearest neighbour is to illustrate metapopulation ranges. As an example of this, I have identified sites that have at least one other adder record within 0.1 - 2 km, and then plotted those sites on Google Earth with a circle of 2 km radius. Other validated records that do not have a neighbour within 2km are plotted with a circle of 500 m (just to put them on the map and differentiate them from the main metapopulation - these records could also be plotted with a 2 km radius). The results are useful for identifying areas where survey effort may be better directed. See the attached graphic: 
In trying to understand metapopulations (and defining favourable conservation status), I aim to look at the habitat that is available within each of these defined polygons. It may be better to consider range as 'potential range' and give distances that are defined by the time of year. For example, maximum dispersal distance is likely to be between hibernacula and foraging site. It may therefore only be relevant to plot distances (whether they are 2 km or another value) for records generated up to the end of April. Records collected during this period are likely to be for animals situated close to their hibernacula. Another possibility is defining potential dispersal distances by the number of sites that are situated within a predefined distance - the more sites located within the target range, the larger the potential maximum range plotted (up to a maximum limit that equates with the target range). The latter approach may help to control for populations where the factors limiting dispersal are unknown - sites with good dispersal potential are likely to have more records situated nearby. In fact I quite like the latter approach... Clearly there is more work to do and I'm likely to be a very busy boy over the next few months! Lee Brady Kent Herpetofauna Recorder | Independent Ecological Consultant |
|
Vicar Senior Member Joined: 02 Sep 2004 No. of posts: 1181 View other posts by Vicar |
Posted: 06 Aug 2009 Heh, Yeah...this is going to be tricky at this level of abstraction  I totally agree with your seasonal assessment. I've been using records at the beginning of the year (to mid April) as an indicator for hibernacula location. The trouble with locating dispersal data (IMO) is that you cannot tell from which hibernacula nodes the animals have originated. You could do some habitat analysis to identify potential barriers and make some assumptions...but are we even sure what a habitat barrier looks like? The only way I can see this providing definitive results is by mark-recapture (hugely intensive and difficult at the county level). We've had some success with Ca, as ALL sightings (almost) are photographed, databased and the unique animal identified. Trouble with Ca is that is takes years to build up significant stats and re-captures. We're only on year 2 now. Distribution is possible, dispersal...is going to have to be pretty wooly imo. As you say, there will be sites where the animals cannot disperse, due to habitat restrictions. How will you know that a 'summer' sighting is not from an undetected hibernaculum area? I think a useful goal would be to produce a very simple Vb HSI, using only data that is already available at county level. Steve Langham - Chairman 
Surrey Amphibian & Reptile Group (SARG). |
|
Caleb Forum Coordinator Joined: 17 Feb 2003 No. of posts: 448 View other posts by Caleb |
Posted: 06 Aug 2009 [QUOTE=calumma]this process takes a little while. Each of the species records has to calculate distances to every other of the records of that species to find out which one is the nearest[/QUOTE] I don't know if I'm teaching you to suck eggs here... but there are some ways to speed this up. An easy one is to use squared distance instead of distance for the comparison- doing square roots can take quite a long time, and you don't need the exact distance until you've found the nearest neighbour. You could also reject anything that's obviously outside the range you're interested in; if N-S or E-W distance is >2km, then you don't even need to consider it as a possible neighbour. If every distance check is doing a conversion from (e.g.) grid refs to some other coordinate system, you'd be better off storing this for/with every record at the start. Hope that helps... |
|
calumma Senior Member Joined: 27 Jun 2003 No. of posts: 351 View other posts by calumma |
Posted: 06 Aug 2009 [QUOTE=Caleb] You could also reject anything that's obviously outside the range you're interested in; if N-S or E-W distance is >2km, then you don't even need to consider it as a possible neighbour. [/QUOTE] True, but setting the maximum distance can be problematic. For adder the most isolated population is currently 3.3 km and this figure varies for species (10.6 km for marsh frog). I do try to speed up the analysis using the most efficient algorithm that my brain can deal with and since I am interested in the distance to records that are not situated on the same spot, I also exclude duplicate 6 figure grid references (I chose 6 figure rather than 8 or 10 to maximise the number of included records). But I want my results now ! 
Lee Brady Kent Herpetofauna Recorder | Independent Ecological Consultant |
|
Vicar Senior Member Joined: 02 Sep 2004 No. of posts: 1181 View other posts by Vicar |
Posted: 06 Aug 2009 Just had another thought Lee.... At some point, you may want to quantify the results (Area FRVs etc). It may be beneficial using grids rather than radii, else you'll end up having to calculate the dispersal overlaps. Now that will take a long time to process! (<-- T-shirt wearer). Also, you can make the precision of a sighting a variable, which is useful for obfuscation (or aggregation). 6-figure OSGBLGR = 1 hectare etc. You're right that this needs to be done, else that one tin which has been checked 1000 times will bias some of the stats. Excellent point re square distances Caleb! - must check I've done that. Steve Langham - Chairman
Surrey Amphibian & Reptile Group (SARG). |
|
armata Forum Specialist Joined: 05 Apr 2006 No. of posts: 928 View other posts by armata |
Posted: 06 Aug 2009 I have to dash off for a few days but some quick points. Male, female immature, neos display different dispersal. e.g. breeding females stick around the hib area. Neos don't disperse until their second or third year and return to hibernation sites at random i.e. following conspecific scent trails. (Genetic stability maintained throughout an area thus). In a general area a number of sub-populations will exist but all may utilise the same summer grounds. Then there are urban areas where migration is denied. This is all ,long term stuff and required the ID of individuals. You may have a stats programme that can indicate probabilities. 'I get my kicks on Route 62' |
|
Vicar Senior Member Joined: 02 Sep 2004 No. of posts: 1181 View other posts by Vicar |
Posted: 06 Aug 2009 [QUOTE=armata]Neos don't disperse until their second or third year[/QUOTE] This I had not heard! Question... I've often seen neo adders hunting lizards at Thursley on the wet bog areas. Presumably the hibernaculum isn't very close by, as I would have thought that flooding would be an issue. My conclusion was that neos may also migrate to summer grounds (following scent trails). Maybe there is a hibernaculum close by? or maybe animals behave differently in different environments? I guess it's hard to say without definitive mark-recapture. Steve Langham - Chairman
Surrey Amphibian & Reptile Group (SARG). |
|
armata Forum Specialist Joined: 05 Apr 2006 No. of posts: 928 View other posts by armata |
Posted: 06 Aug 2009 I guess each area has some unique aspects. Cors Caron in Ceridigion is a good example. One sub-population hibernates just a few cm above the water table in sphagnum bog and stick around the area for the whole active season. However, those from the nearby sub-population on the old railway migrate to the sphagnum bog; distance from 500m - 1km. Also, unusually, the adults feed largely on frogs. The neos feed on Common lizard of which there is a very high density. Also remember, neo adders (plus CAs,SLs and SWs, have been found to hibernate in the summer ground within molinea tussocks. Furzbrook, Hartland, Studland, all good examples of this. There are also odd examples. After giving birth most females will disperse to feed in the summer ground. However, some I have recorded giving birth in the summer ground; so always be prepared for surprises. 'I get my kicks on Route 62' |
|
calumma Senior Member Joined: 27 Jun 2003 No. of posts: 351 View other posts by calumma |
Posted: 06 Aug 2009 [QUOTE=Vicar] Also, you can make the precision of a sighting a variable, which is useful for obfuscation (or aggregation). 6-figure OSGBLGR = 1 hectare etc. [/QUOTE] Yes, I agree this is useful and have already set up precision as a variable (actually for other reasons, but can see you point here as well). The comparison between area and available habitat is a little ways off so I'm not too concerned about that aspect of the analysis just yet (so long as I cover my bases and ensure the data now being generated is being stored in the most appropriate format). Lee Brady Kent Herpetofauna Recorder | Independent Ecological Consultant |
|
calumma Senior Member Joined: 27 Jun 2003 No. of posts: 351 View other posts by calumma |
Posted: 06 Aug 2009 [QUOTE=armata] Male, female immature, neos display different dispersal. e.g. breeding females stick around the hib area. Neos don't disperse until their second or third year and return to hibernation sites at random i.e. following conspecific scent trails. (Genetic stability maintained throughout an area thus). [/QUOTE] I've just exchanged emails with Gareth discussing this very issue. A problem is the number of available records for different lifestages. For example the db holds 1139 adder records, but only 227 of them are for immatures. Whilst I accept that different lifestages will have different dispersal distances, ultimately what I am hoping to illustrate is the maximum potential dispersal from each site (as defined by a 6 fig grid reference). It *may* therefore be appropriate to use the overall maximum dispersal distance for the initial analysis. Of course there is no reason why the db cannot hold the additional dispersal data and the analysis updated once sufficient records become available. Lee Brady Kent Herpetofauna Recorder | Independent Ecological Consultant |
|
Suzi Senior Member Joined: 06 Apr 2005 No. of posts: 860 View other posts by Suzi |
Posted: 06 Aug 2009 I would just like to ask what depth of a suitable habitat do adders need/like? A route that I walk every year to spot adders (stoney track with coarse grass firebreak backed by heather which adders lie along the edge of) has not produced one so far. Sure I might not be there at optimum times but nevertheless not a one so far this year over a dozen visits at least. Around this route the cattle grazing has intensified and the cattle now have access to the heather itself. Horses have been introduced close by as well. A large area of molina was burned out adjacent to the route probably during winter. Add to this the scraping in the vicinity of bare patches and I just wonder how much adders will take. I guess this group of adders might have pushed off onto another part of the heath but again cattle, scraping etc. Sorry to have hijacked this thread! Suz |
|
calumma Senior Member Joined: 27 Jun 2003 No. of posts: 351 View other posts by calumma |
Posted: 06 Aug 2009 I am at this very moment trying to get to grips with this issue myself Suzi. In a nutshell, the larger and more connected the site the better - but what we really need is a HSI that is directed towards reptiles. To date my efforts on development of a reptile HSI have been thwarted by the issue of site definition. For amphibians, HSI's are usually applied to a pond with each pond representing a discrete 'site' that is relatively easy to define (so much so that I have recently created a new table in my db to hold waterbody as site data, but I digress...). Defining a reptile 'site' can be very problematic and the habitat factors that need to be quantified are likely to vary quite considerably across large sites. Rather than attempting to define HSI based on 'site', it may therefore be more useful to define HSI based on recording unit. Of course, this approach may result in area becoming a fixed variable (e.g. hectare blocks of land). I'm not sure if this is useful and it certainly wouldn't help answer your question. It may therefore be acceptable to attempt to define the recording unit as a clearly demarcated block of habitat (e.g. a grassland field or even a patch of scrubby grassland in the middle of a large expanse of arable). The larger the 'site', the more of these habitat units there are likely to be. An alternative approach is to define reptile HSIs in broader terms at the landscape level - but individual site area could be lost in such an approach. In effect this is what I am trying to achieve with the favourable conservation assessment of adder in Kent - available suitable habitat vs occupancy of said areas etc. It may be worthwhile spinning off your question into a new thread - what is the smallest discrete block of land in which adder has been recorded? Lee Brady Kent Herpetofauna Recorder | Independent Ecological Consultant |
|
Vicar Senior Member Joined: 02 Sep 2004 No. of posts: 1181 View other posts by Vicar |
Posted: 06 Aug 2009 ROFL!...I have literally JUST sent you an email lee about exactly this issue! Steve Langham - Chairman
Surrey Amphibian & Reptile Group (SARG). |
|
armata Forum Specialist Joined: 05 Apr 2006 No. of posts: 928 View other posts by armata |
Posted: 06 Aug 2009 There are records of traditional mating areas away from the hibernation site, some distance away in fact. However, this is in Germany, but I wonder if anyone has records of adders dispersing to mating grounds. I have no such records for the southern heaths or mid-Wales. When I say dispersal, I mean a significant distance a km or more. If this does happen then it makes defining core areas a little more difficult. 'I get my kicks on Route 62' |
|
calumma Senior Member Joined: 27 Jun 2003 No. of posts: 351 View other posts by calumma |
Posted: 06 Aug 2009 Steve - just got it! At least we are thinking along the same lines
It may also be worth considering a Level 4 that incorporates more refined land classifications that correspond to data available at local records centres. Take a look at the Kent Landscape Information Service website as an example of what I mean. Lee Brady Kent Herpetofauna Recorder | Independent Ecological Consultant |
|
calumma Senior Member Joined: 27 Jun 2003 No. of posts: 351 View other posts by calumma |
Posted: 06 Aug 2009 Actually the KLIS website doesn't look like it shows all of the different habitat breakdowns. I believe more detailed information is available on their GIS - and I aim to get a copy of this. The following screenshot illustrates what we should be able to do once we overlay estimated occupancy areas on top of the habitat data. 
This example is based on individual adder records, but I aim to take a more landscape level approach to the analysis. Lee Brady Kent Herpetofauna Recorder | Independent Ecological Consultant |
|
calumma Senior Member Joined: 27 Jun 2003 No. of posts: 351 View other posts by calumma |
Posted: 06 Aug 2009 Just for fun, here is a map illustrating occupied gcn ponds for Kent. Larger circles this time represent 1 km radii and indicate waterbodies that have another gcn record (any record, not just occupied pond) within 1 km. Small circles represent more isolated records and are drawn with a radius of 500 m. 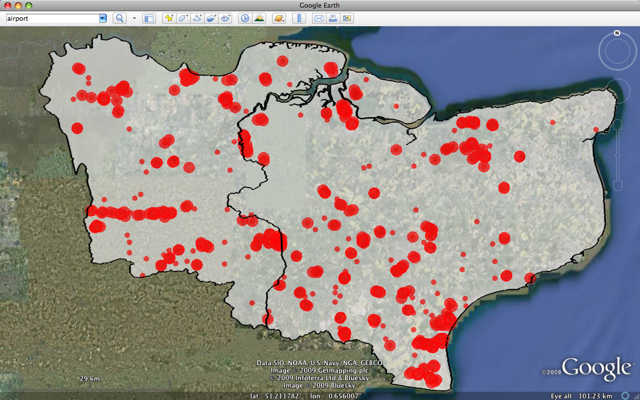
Bias in survey effort is a problem for any recording project and the above map has a classic example. Spot the gcn ponds along the Tonbridge pipeline survey! Looking at the large number of gaps in the low weald indicates that we still have a long way to go with this species. That Tonbridge pipeline demonstrates what the whole of the low weald should look like 
Lee Brady Kent Herpetofauna Recorder | Independent Ecological Consultant |
|
calumma Senior Member Joined: 27 Jun 2003 No. of posts: 351 View other posts by calumma |
Posted: 06 Aug 2009 I should also point out that there are nearly 2000 gcn records on the KRAG db. However, several hundred of these are either terrestrial observations or do not specify whether the observation was on land or in water. For the map above, I was interested in plotting records that were confirmed as originating in a waterbody. There would be quite a few more red dots if I was less demanding ! Lee Brady Kent Herpetofauna Recorder | Independent Ecological Consultant |
|
calumma Senior Member Joined: 27 Jun 2003 No. of posts: 351 View other posts by calumma |
Posted: 07 Aug 2009 [QUOTE=Caleb] An easy one is to use squared distance instead of distance for the comparison- doing square roots can take quite a long time, and you don't need the exact distance until you've found the nearest neighbour. [/QUOTE] Happy to suck eggs on things when it saves helps make the db more efficient
Using the squared distance is relatively straightforward to incorporate into my nearest neighbour script so I will updating things after work. One issue that I have had is that I developed the routines for calculating distances for other purposes - listing records in order of distance from a point of interest, whilst also providing a bearing. However, it is fairly trivial to use a different field for the large scale nearest neighbour calculation and for that I can rely on the squared distance. Just in case anybody else is trying to keep up with some of these more geeky discussions on calculating distance between two points, there is a really excellent summary available here. BTW apologies for the poor formating of the post. However, I seem to have problems retaining line break formatting and links when posting to the forum from Safari. Not sure if this is a browser specific issue (I use Safari). Lee Brady Kent Herpetofauna Recorder | Independent Ecological Consultant |
|
calumma Senior Member Joined: 27 Jun 2003 No. of posts: 351 View other posts by calumma |
Posted: 07 Aug 2009 Not yet addressed some of Vicar's points. [QUOTE=Vicar] Distribution is possible, dispersal...is going to have to be pretty wooly imo. As you say, there will be sites where the animals cannot disperse, due to habitat restrictions. [/QUOTE] What I am suggesting is that we can use maximum likely dispersal as a proxy for predicting distribution from confirmed locations. I completely agree that the prediction is woolly. However, I am less concerned about this at the moment, because it is a prediction that will become less woolly as more records are collected. In areas where animals cannot disperse we may expect less records. I am therefore minded to use the count of nearest neighbour(s) as a proxy for estimating the prevalence of dispersal barriers ('dispersal potential'). Of course, this all relies on a good data set. But I would hope that as more records are collected the prediction would become more refined. The estimate is also likely to be less woolly for species with larger potential dispersal distances. The smaller the dispersal distance, the more records that are needed to adequately identify distribution boundaries. Grass snake may have been an easier species to start with, but since adders have such a well defined range in Kent they are perhaps a more interesting target. [QUOTE=Vicar] How will you know that a 'summer' sighting is not from an undetected hibernaculum area? [/QUOTE] We wouldn't. However, a site with only summer sightings can be flagged within the db for early spring survey work. If I chose to use nearest neighbour as a proxy for dispersal potential, it may not be necessary to control for season. Of course the beauty of a relational database is that this information can still be stored and turned on at some point when the dataset is considered sufficiently large. [QUOTE=Vicar] I think a useful goal would be to produce a very simple Vb HSI, using only data that is already available at county level. [/QUOTE] Yep. My aim is to correlate the predicted presence of a species in a specified habitat type against (1) the area that that habitat covers across the county (potential range) and (2) habitat within the polygons defined by available records and maximum likely dispersal (predicted range). Maximum likely dispersal is a variable that can be defined by species, lifestage, observation date and dispersal potential. Sorry, this all probably sounds horribly complicated to other folks reading the thread! It isn't really - honest. Both Vicar and I are aiming to achieve the same ends, the difference at the moment is in the methods that we may use to estimate overall distribution. Vicar, if I remember correctly you use a statistical routine to predict presence based on nearest neighbour. As I understand it, your method would involve dividing the area of interest into a number of blocks (defined by 6 figure grid references?) and then predicting the likely presence of each species in that block using statistical analysis of the nearest neighbour dataset? Presumably you would then compare predicted presence against HSI to further refine the occupancy estimate? Or perhaps only run the calculation on those squares already flagged by the HSI? I guess what I am suggesting is to incorporate maximum likely dispersal into the calculation as a way of helping to further refine the estimate. A last comment - honest! We should also remember that presence of a species on a site may well be a consequence of historical dispersal. Just because a site is now isolated doesn't mean that is wasn't colonised at an earlier time. Lee Brady Kent Herpetofauna Recorder | Independent Ecological Consultant |
- Adder Dispersal Distances |